

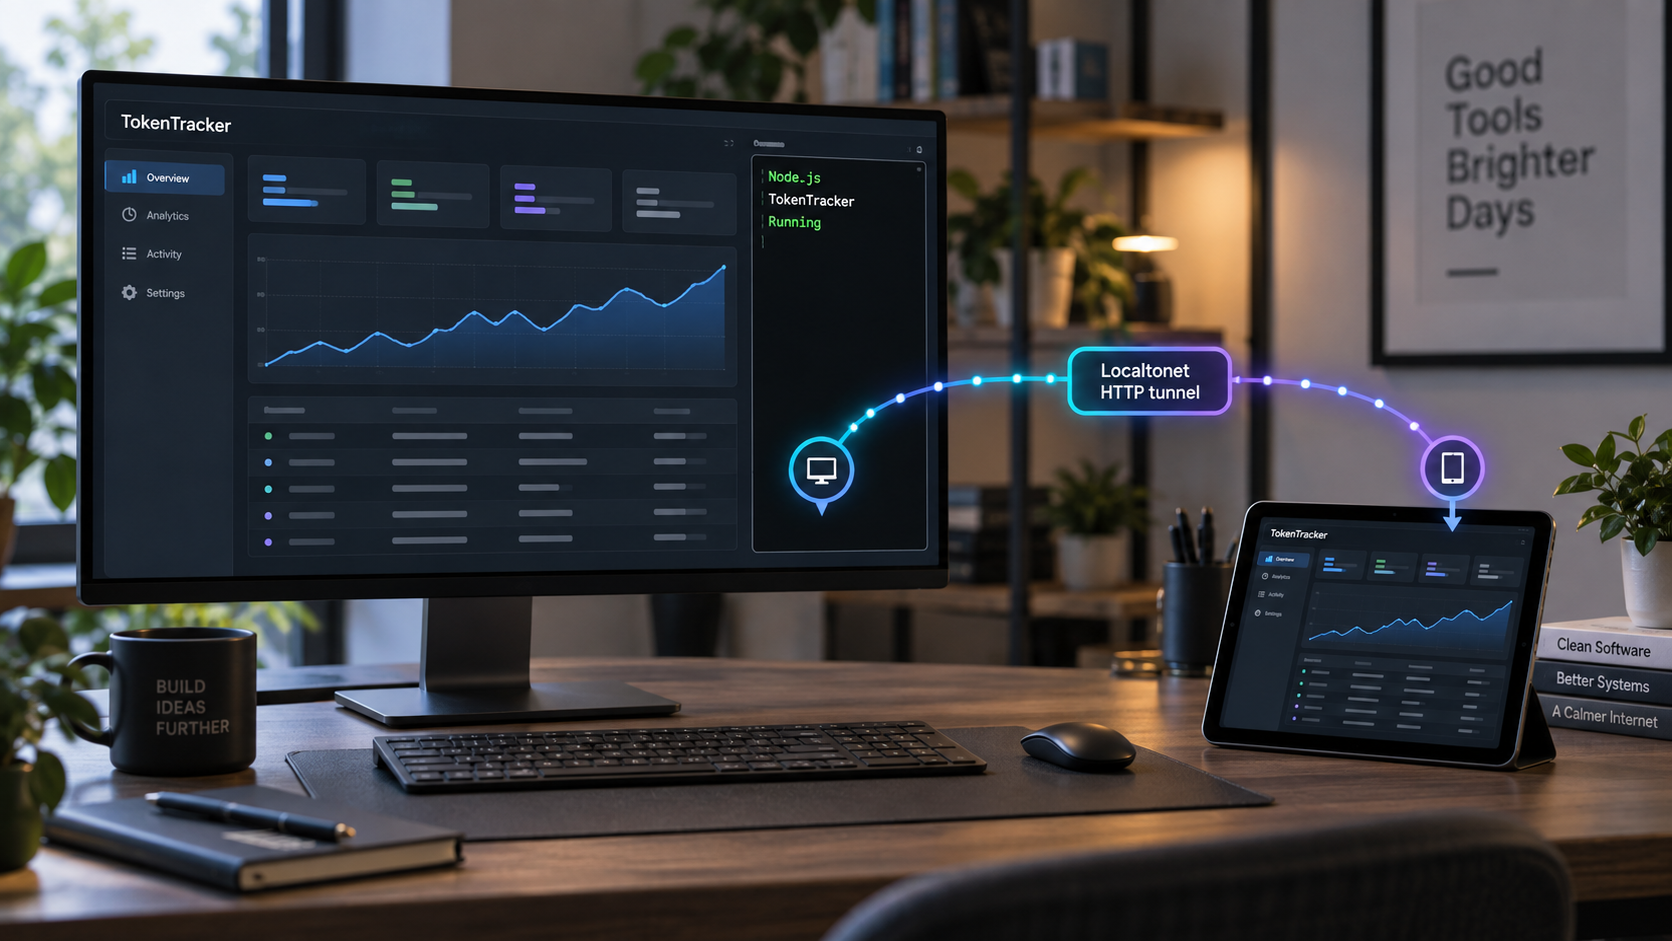
Build a local AI usage dashboard first, then publish it only when remote access is actually required
TokenTracker is a local-first dashboard for monitoring token usage and estimated costs across supported AI coding tools. In this guide, we install its Node.js CLI on macOS, Linux, or Windows, confirm that the dashboard works at http://localhost:7680, review routine commands, and troubleshoot common startup problems. After the local deployment is healthy, we connect it to an HTTP tunnel with Localtonet so an authorized remote browser can reach it without inbound router port forwarding, firewall changes, a VPN, or a public IP address. Because TokenTracker's documented dashboard authentication is not established by the available project information, we also explain why public exposure requires a deliberate security decision rather than an assumption that the dashboard is protected by default.
📋 What's in this guide
How the TokenTracker and Localtonet workflow fits together
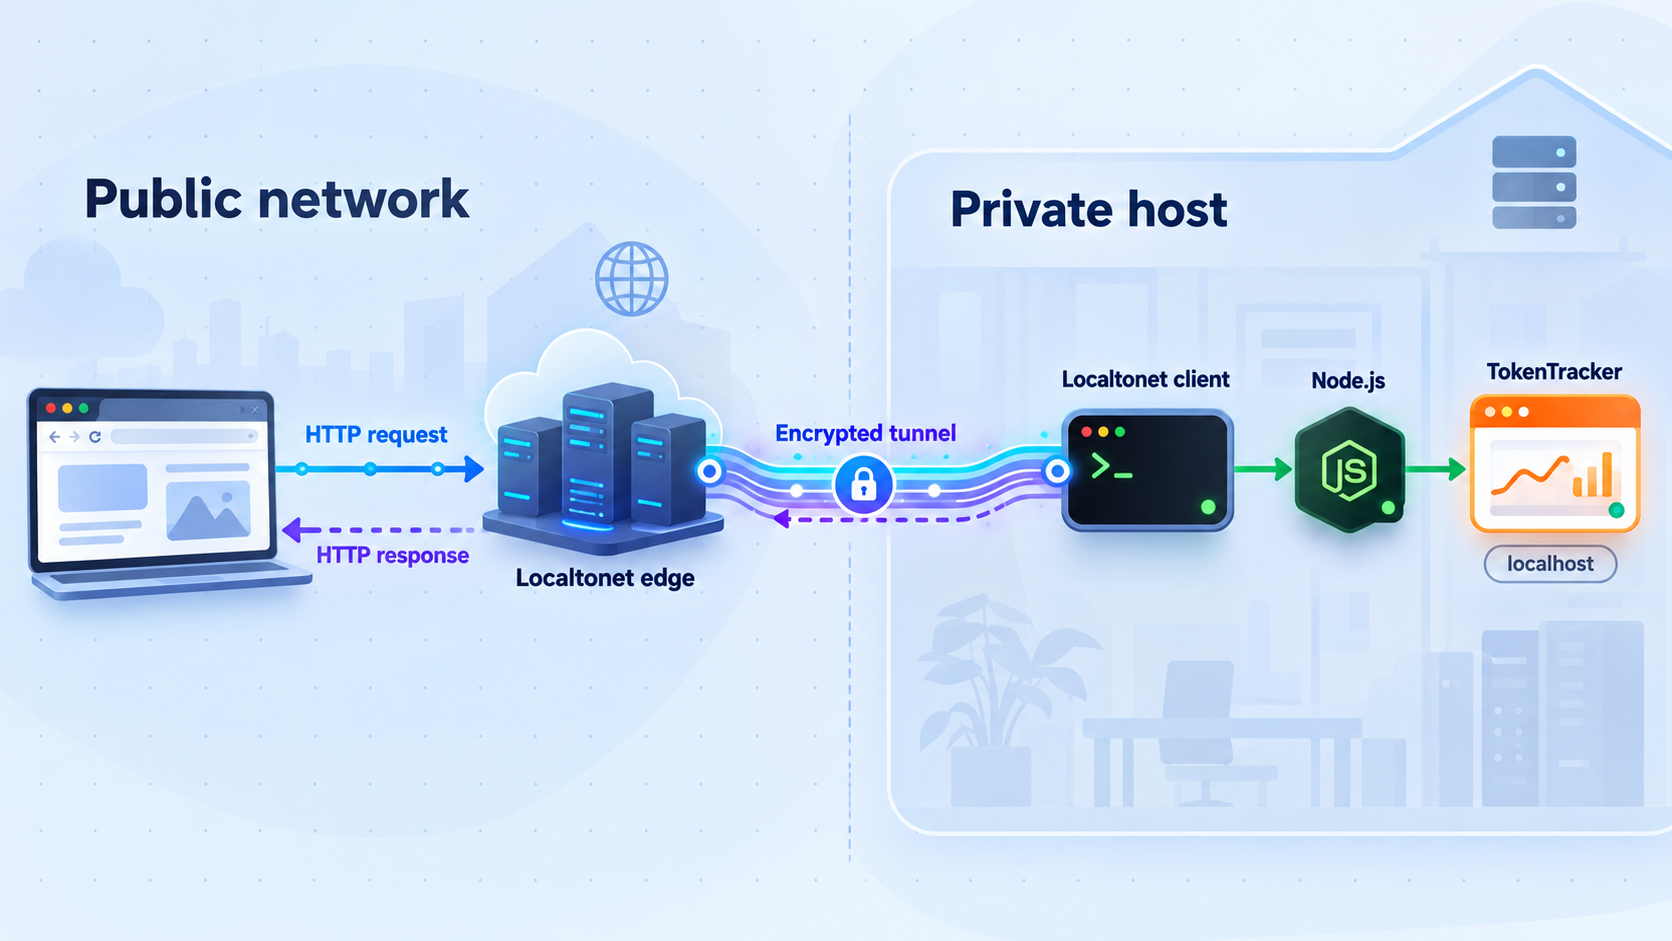
TokenTracker collects usage information from supported AI coding tools and presents normalized usage data through a browser dashboard. Its current project documentation describes support for 40 tools, including Claude Code, Codex CLI, Cursor, Gemini CLI, GitHub Copilot, OpenCode, LM Studio, DeepSeek Harness, and other coding assistants. Integrations vary by tool. Some use hooks, some inspect local databases or logs, and others use passive readers. The first CLI run detects supported tools installed on the machine, installs the applicable hooks, synchronizes available data, and opens the dashboard.
The service is local-first. TokenTracker states that it tracks token counts rather than prompts or conversation content, and it does not require an account or API keys for its local dashboard. Its optional cloud behavior is separate from the local installation described here. This guide focuses on running the dashboard locally and does not require enabling optional cloud synchronization.
The documented browser address is http://localhost:7680. The hostname localhost normally means that a browser must run on the same computer as TokenTracker. That is a useful default because it limits ordinary network reachability, but it also means that opening the address directly from another laptop or phone will not reach the service.
With Localtonet, our client application runs on the machine that can reach TokenTracker. The client establishes an outbound connection to a Localtonet relay server. An HTTP tunnel then maps a public HTTPS address to the local HTTP target. This does not require inbound router port forwarding, firewall changes, VPN setup, or a public IP address. The tunnel remains available only while the selected Localtonet client is connected and the tunnel is running.
A tunnel cannot repair a TokenTracker installation that is not running. Always verify http://localhost:7680 from the host computer before creating the HTTP tunnel. This separates application problems from connectivity problems and makes troubleshooting much faster.
Prerequisites and deployment decisions
The Node.js CLI is the most direct installation path for this tutorial. TokenTracker documents Node.js 20 or newer as the requirement for the CLI, which runs on macOS, Linux, and Windows. You also need npm or npx, a browser on the host for local verification, and at least one supported AI coding tool if you want the dashboard to display real usage.
You do not need to configure a provider API key merely to start the documented local dashboard. TokenTracker reads supported local usage sources and normalizes their data. The amount of information shown depends on which supported tools are installed, whether they have generated usage, and whether TokenTracker can access their relevant local data.
Confirm Node.js and npm
Open a terminal, PowerShell window, or command prompt and check the installed versions:
node --version
npm --version
The Node.js result must report major version 20 or newer for the documented CLI requirement. If node, npm, or npx is not recognized, install a current Node.js release appropriate for your operating system, restart the terminal, and run the checks again. This article does not prescribe an operating-system package command because Node.js installation methods and package names differ by platform and distribution.
Choose the computer that will host the dashboard
Install TokenTracker on the computer where the supported AI coding tools and their local usage records exist. Installing the dashboard on an unrelated server will not automatically make workstation logs available there. The host should also remain powered on while you expect to use the dashboard.
If you later use Localtonet, run our client on that same computer whenever possible. The local target can then be localhost on port 7680. A Localtonet client can also target a service reachable from its device, but that introduces another network path and more variables. The same-host layout is simpler for this workflow.
Decide whether remote exposure is appropriate
The available TokenTracker documentation establishes a local dashboard but does not establish built-in dashboard authentication or authorization for this deployment. Do not interpret a public HTTPS URL as proof that the application itself has user authentication. Transport to a public edge and authorization to view an application are different security concerns.
Token and cost analytics can reveal work patterns, active projects, model choices, and operational activity even when prompts are not collected. Before creating a public tunnel, confirm that public reachability is acceptable for your environment and add an appropriate access-control layer if unauthorized viewers must be excluded. If you cannot verify adequate protection, keep the dashboard local and start a temporary tunnel only for a controlled session.
| Requirement | Why it is needed | How to confirm it |
|---|---|---|
| Node.js 20+ | Required by the TokenTracker CLI installation path | Run node --version |
| npm and npx | Downloads or installs the published CLI package | Run npm --version and use the documented npx command |
| Supported local usage source | Provides data for meaningful dashboard analytics | Run TokenTracker status and inspect the detected integrations |
| Browser access on the host | Verifies the local HTTP service before tunneling | Open http://localhost:7680 |
| Localtonet client and device token | Required only for the remote-access phase | Confirm the selected device is connected in our platform |
Install and start TokenTracker with Node.js
TokenTracker supports two closely related Node.js installation approaches. The simplest is to execute it with npx. A global npm installation is useful when you want the shorter tokentracker command for repeated operations. Choose one primary approach rather than installing globally merely because both are available.
Option 1: Start TokenTracker with npx
Run the documented quick-start command:
npx tokentracker-cli
On the first run, npx may need to retrieve the package. TokenTracker then detects supported AI tools, installs applicable hooks, synchronizes available data, starts its local service, and opens the dashboard at http://localhost:7680. Allow the initial process to complete before deciding that an empty or partially populated dashboard is a failure.
Keep the terminal visible during the first start. Any package-download, permission, hook, database, or port error is more useful than a generic browser failure. If the browser does not open automatically, manually enter the documented URL rather than assuming the service failed.
Option 2: Install the CLI globally
For shorter recurring commands, install the published CLI globally:
npm i -g tokentracker-cliThen start TokenTracker:
tokentracker
A global installation adds the executable to npm's global command location. If installation succeeds but the shell reports that tokentracker is unknown, open a new terminal and confirm that npm's global executable location is included in the account's command path. The exact path is platform-specific, so do not copy an arbitrary path from another operating system.
What the first run changes
TokenTracker's zero-configuration experience includes automatic integration setup for detected tools. The exact change depends on the source application. For example, some integrations use session-end hooks, some use notification arrays or plugins, and some only read existing local data. This means the first run is more than simply rendering a static web page.
Run it under the same operating-system account that owns the AI tool configuration and usage records. Running under a different administrator, service, container, or remote account can change which home directory and tool data TokenTracker sees. Elevation should not be added without a documented need, since unnecessary administrator execution can also create ownership and permission complications.
The web interface can be healthy even if no supported usage has been imported yet. First confirm that the page loads. Then use the status and doctor commands, verify that a supported tool is detected, and generate new activity with that tool if necessary.
Other supported installation paths
TokenTracker also publishes native desktop packages. These are valid alternatives, but they are not required for the Node.js workflow in this guide. Do not combine multiple installation paths unless you understand which process is serving the dashboard.
| Installation path | Supported environment | Important behavior or requirement |
|---|---|---|
npx tokentracker-cli |
macOS, Linux, and Windows with Node.js 20+ | Fastest CLI start without a separate global installation |
| Global npm package | macOS, Linux, and Windows with Node.js 20+ | Provides the shorter tokentracker command |
| Homebrew CLI | macOS | Installs the CLI through the project's documented Homebrew formula |
| macOS native app | macOS | Available as a DMG or Homebrew cask with menu-bar integration |
| Windows native app | Windows | Available as a per-user installer and as a portable archive |
| Linux AppImage | 64-bit Linux systems compatible with the published package | Self-contained package; mark it executable before running |
| Linux .deb or .rpm | Compatible Debian, Ubuntu, Fedora, or RHEL-family systems | Uses distribution libraries; the documented .deb is not suitable for Debian 12, where the AppImage is recommended |
On Linux, the native AppImage, .deb, and .rpm packages bundle the Node runtime and dashboard. The AppImage also carries its own GTK, WebKitGTK, and appindicator components. The distribution packages instead link against their corresponding system libraries. On GNOME, the tray icon requires an AppIndicator extension. These details matter for the native application, but they do not change the Node.js 20+ requirement for the CLI installation covered above.
Verify TokenTracker locally before creating a tunnel
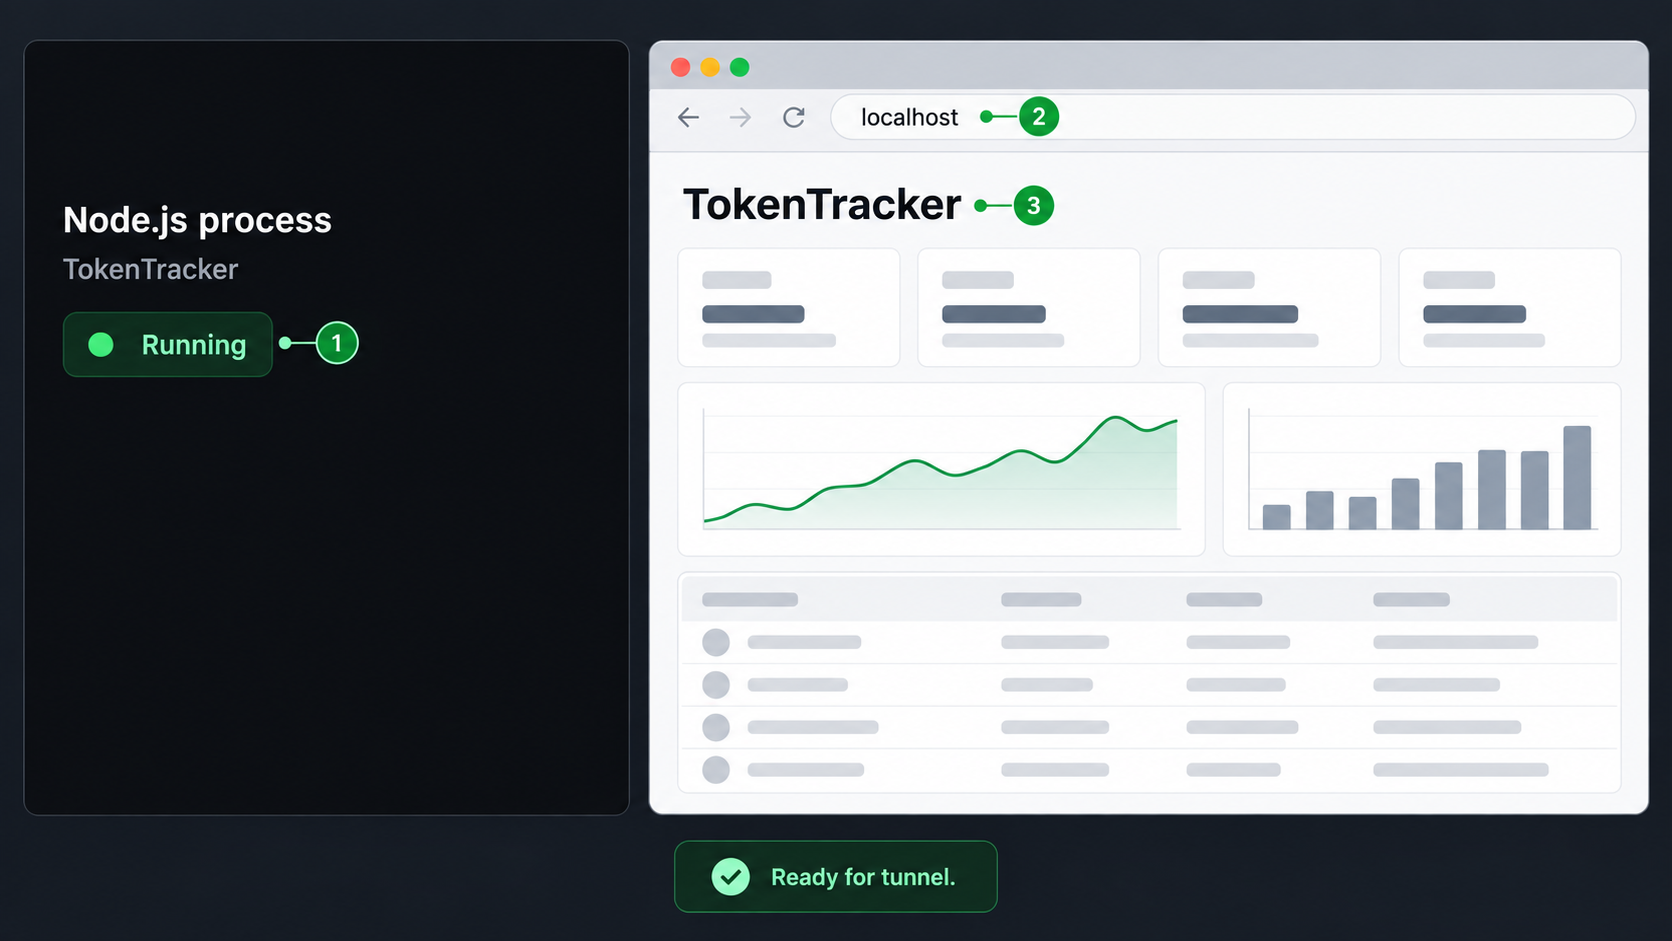
Local verification should answer three separate questions: Is the HTTP server responding? Does TokenTracker recognize the expected integrations? Is usage data appearing as expected? Treat these as separate tests so that a data-import issue is not mistaken for a networking issue.
Open the documented local URL
On the TokenTracker host, open:
http://localhost:7680A working page confirms that the browser can reach the local HTTP service. Review the available dashboard views and make sure navigation works. Depending on the data TokenTracker has found, views can include trends, model breakdowns, cost analysis, project attribution, activity heatmaps, usage limits, and related local analytics.
Do not change the port in the browser or in the later tunnel configuration unless you have verified that your TokenTracker instance is actually listening somewhere else. The supplied project documentation establishes port 7680 as the default dashboard address but does not provide an evidenced port-customization procedure for this guide.
Check integration status
If you used the global installation, run:
tokentracker statusThis checks hook and integration status. TokenTracker also documents two output-oriented variants:
tokentracker status --json
tokentracker status --light
The JSON form provides a machine-readable summary suitable for structured inspection. The light form provides a plain ASCII table without a spinner, which is useful in CI or SSH sessions. These commands are especially helpful when the dashboard opens but does not show the expected source.
Run the health check
tokentracker doctorUse the doctor command to perform the project's health check. Read its actual output instead of applying unrelated fixes. A warning about one integration does not necessarily mean the dashboard server itself is unavailable.
Trigger a manual synchronization
tokentracker syncA manual sync asks TokenTracker to process currently available usage information. After it completes, refresh the local browser. If no data appears, confirm that the relevant AI coding tool is supported, that it has generated usage under the same user account, and that TokenTracker reports the integration as detected.
If http://localhost:7680 does not work on the host, do not create or modify a Localtonet tunnel yet. Resolve the TokenTracker process, package, port, or local permission problem first. The tunnel depends on a reachable local target.
Routine operation and maintenance
A self-hosted dashboard needs a clear operating model. Decide who starts it, how long it should run, how updates are handled, and whether remote access should be permanent or temporary. The project evidence supplied for this guide does not establish a Node.js service manager configuration or an automatic background-start command, so this article does not invent one.
Starting the dashboard
With a global installation, run tokentracker. With the npx workflow, run npx tokentracker-cli. Keep the process running for as long as the dashboard is needed. If closing the terminal stops the process in your environment, the dashboard and its Localtonet target will become unavailable.
Refreshing usage data
TokenTracker integrates with different tools in different ways. Some data arrives through hooks, while passive readers inspect data maintained by the source application. Use tokentracker sync when you need a documented manual synchronization, then refresh the dashboard.
Checking health after changes
Run tokentracker status and tokentracker doctor after changing an AI tool, moving user data, upgrading Node.js, or updating TokenTracker. Then repeat the browser test. This sequence verifies the integration layer and the HTTP layer before remote connectivity is involved.
Updating the installation
Update behavior depends on the chosen installation method. With npx, package retrieval and caching are managed by npm tooling. A global npm installation is updated through npm's normal package-management workflow. Homebrew and native package users should follow the update mechanism for that package type. Before updating a machine that others depend on, note the currently working installation method and verify the local dashboard again after the update.
Do not assume that running both a native desktop app and the Node.js CLI is harmless. If both attempt to start the dashboard on port 7680, one process may be unable to bind the port. Prefer a single active installation unless the project explicitly documents coexistence for your version.
Expose the working dashboard through a Localtonet HTTP tunnel
Once the local dashboard responds correctly, an HTTP tunnel is the appropriate Localtonet family for the browser-based service. The tunnel points to the local IP address and port reachable from our client device. For a same-host installation, that target is the host's loopback address and port 7680.
HTTP tunnels can use a random subdomain, a custom subdomain where supported, or a custom domain. These process types serve the same content at a public HTTPS address. Availability can vary, and custom-domain DNS requirements must be checked against the current dashboard and documentation rather than inferred from this guide.
The documented Localtonet lifecycle matters: creating a tunnel does not start it. You must press Start, and you can later stop or delete it. Follow this sequence after TokenTracker has passed the local verification checks.
Install and run the Localtonet client on the TokenTracker host
Use the device that can already open http://localhost:7680. Keep the client connected while remote access is required. Current installation options should be taken from the Localtonet documentation because client packaging can vary by operating system and version.
Authenticate or select the client device
Use the device-specific authentication token associated with the client that will run the tunnel. Never publish, paste into a tutorial, or share that token. Confirm that the intended device is connected before continuing.
Select an available relay server
Choose a current relay server or region shown in our dashboard. Available server codes and regions must come from the live product rather than a hardcoded value in this article.
Create an HTTP tunnel to TokenTracker
Select the HTTP tunnel family and configure the local target as the TokenTracker host with port 7680. For a Localtonet client running on the same computer, use the local loopback target that reaches the working service. Select the desired process type from the options currently available to your account.
Start the tunnel
Press Start after reviewing the target. Tunnel creation alone does not make the endpoint active. The TokenTracker process and Localtonet client must both remain running.
Test the assigned public address and stop it when finished
Open the assigned public URL from an authorized remote browser and confirm that the expected TokenTracker dashboard appears. When remote access is no longer needed, stop the tunnel. Delete it if the configuration will not be reused.
The public address is usable only while the selected Localtonet client is connected, the tunnel is running, and TokenTracker is responding on the configured local target. A public URL can therefore exist in the dashboard while its application is temporarily unavailable.
Security considerations for a public analytics dashboard
Localhost access and public access have different threat models. A local-only dashboard is generally reachable only from the host. A public tunnel allows traffic from outside that machine to arrive at the service. HTTPS at the public address protects browser transport to the tunnel edge, but it does not by itself decide who is authorized to view the application.
The supplied TokenTracker documentation does not establish a built-in login requirement for the local dashboard. We therefore cannot claim that it is safe for unrestricted public exposure. Before enabling a long-running endpoint, inspect the current TokenTracker release and your Localtonet configuration for access controls that are explicitly available to you. If sufficient authorization cannot be verified, keep access temporary or place a separately managed authentication layer in front of the dashboard.
Also consider what the dashboard reveals. Even if prompts and conversations are not read, usage totals, project attribution, model names, activity timing, costs, and provider information may be operationally sensitive. Teams should decide whether this information is personal, internal, confidential, or suitable for remote sharing.
Use a dedicated non-administrator account where practical, keep Node.js and TokenTracker updated through their supported mechanisms, and review integration changes after upgrades. If the host is shared, verify which users can read the local tool records that TokenTracker processes. Remote access does not change local file permissions, but the dashboard can make processed information visible through its web interface.
Do not share the tunnel address as though possession of the URL proves identity. Use verified access controls appropriate to the sensitivity of your usage data. If none are available in the deployed configuration, the safest documented approach is to leave TokenTracker on localhost and enable a temporary tunnel only under controlled conditions.
Troubleshooting TokenTracker and the HTTP tunnel
The terminal cannot find node, npm, or npx
Confirm that Node.js is installed for the current user and that a new terminal has been opened since installation. Run node --version and confirm major version 20 or newer. Then run npm --version. If another user installed Node.js, your account may not have the same command path.
The tokentracker command is not recognized
This usually distinguishes the npx workflow from the global workflow. The command tokentracker is documented after the global installation:
npm i -g tokentracker-cli
If you did not install globally, use npx tokentracker-cli. If you did install globally, restart the shell and inspect npm's global executable path for your platform.
The browser does not open automatically
Automatic browser launch is convenient but is not the actual health test. Manually open http://localhost:7680. If it loads, TokenTracker is serving the dashboard. If it does not, return to the terminal and inspect the startup output.
Localhost refuses the connection
Confirm that the TokenTracker process is still running. Check whether startup reported a package error or a conflict on port 7680. Avoid launching both the native application and CLI simultaneously unless the project documents that arrangement. Run tokentracker doctor with the global CLI and restart the chosen TokenTracker process after resolving the reported issue.
The dashboard loads but has no usage data
Run tokentracker status to inspect detected hooks and integrations, followed by tokentracker sync. Make sure the AI tool is among TokenTracker's supported integrations and has actual activity under the same operating-system account. Some integrations are passive readers, so their visibility depends on source data existing in the expected local location.
Cursor has an additional implementation detail: TokenTracker uses the system sqlite3 CLI when available and can fall back to node:sqlite on supported Node.js releases. If Cursor is the only missing source, review status and doctor output before changing unrelated dashboard settings.
The local dashboard works, but the public URL does not
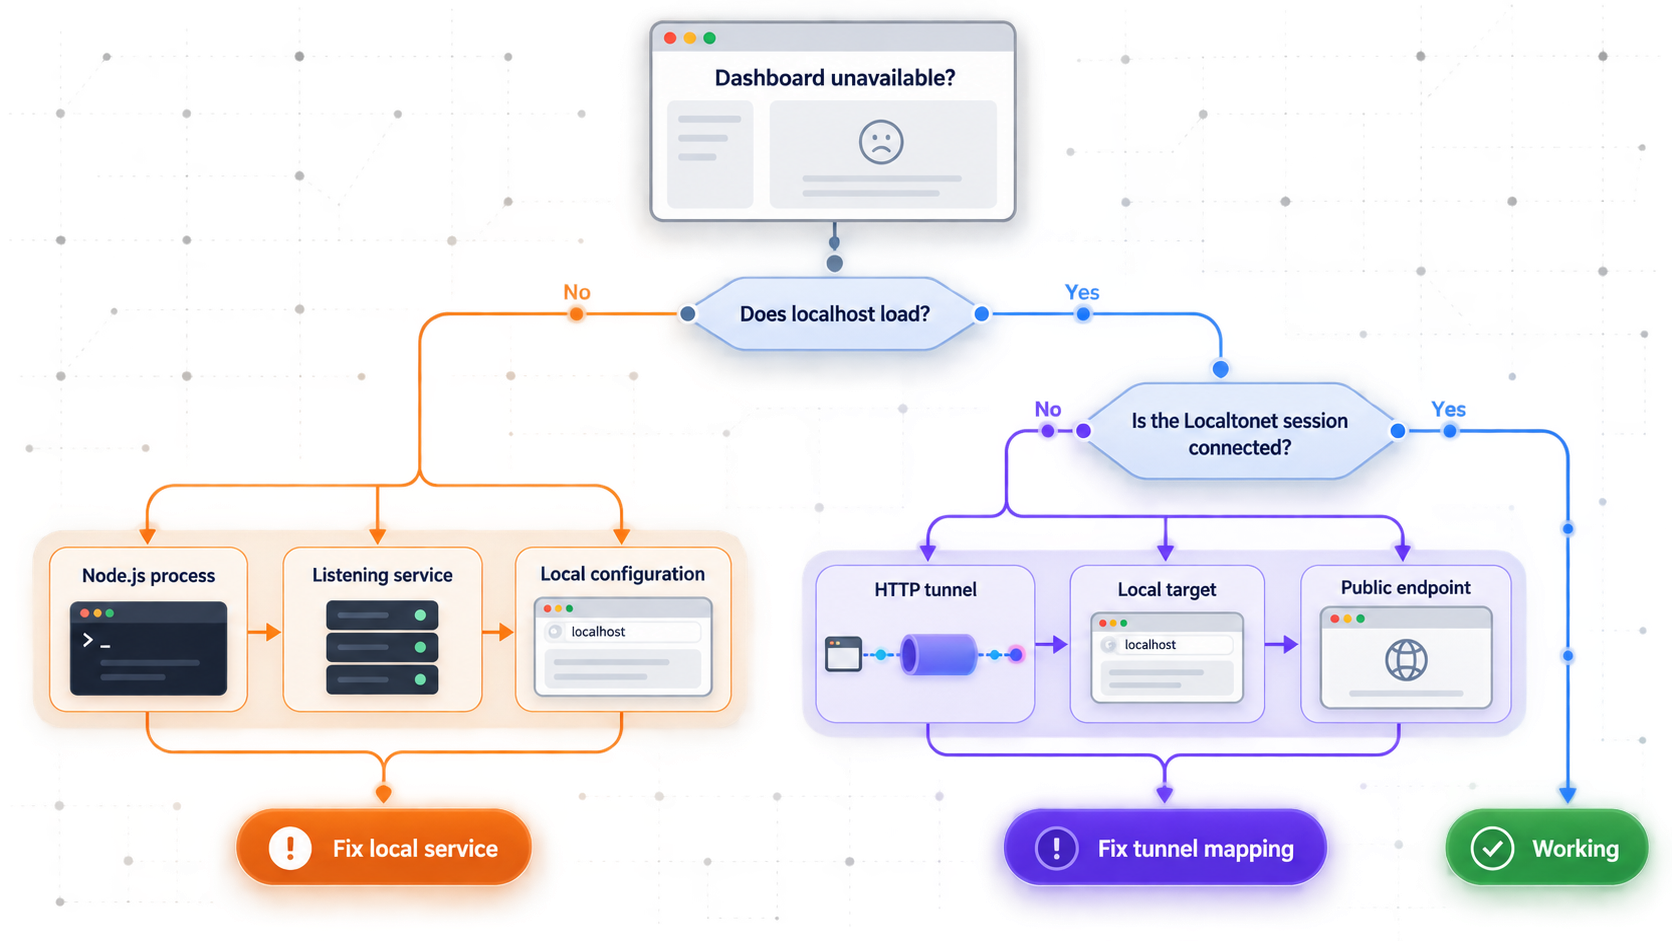
Work through the chain in order:
- Confirm
http://localhost:7680still loads on the host. - Confirm the Localtonet client device is connected.
- Confirm the HTTP tunnel is started, not merely created.
- Confirm the local target uses the correct host and port
7680. - Confirm that the selected tunnel belongs to the intended device.
- Stop and restart the tunnel after correcting a target or process problem.
If the Localtonet client runs in a container, virtual machine, or different network namespace, its localhost may not refer to the TokenTracker host. In that architecture, configure a local address that is genuinely reachable from the client environment. The exact address depends on your network design and should not be guessed.
The public URL works only intermittently
Check whether the host sleeps, the TokenTracker process exits when its terminal closes, or the Localtonet client disconnects. All three components must remain available: the application, our connected client, and the running tunnel. Also verify that another program is not intermittently taking port 7680.
The wrong page appears at the public URL
Stop the tunnel immediately and inspect the local target. Open http://localhost:7680 on the Localtonet client device and verify that it is really TokenTracker. A different process may be occupying the port, or the tunnel may have been attached to the wrong device. Restart TokenTracker and repeat local verification before restoring public access.
The Linux native package does not install
This Node.js tutorial does not require a native Linux package. If you chose the native route, note that TokenTracker documents a Debian 12 incompatibility for its .deb package because the required appindicator package differs from what Debian 12 provides. Use the project's AppImage on Debian 12. On other distributions, use only the matching documented package type and inspect package-manager errors rather than forcing incompatible dependencies.
Frequently asked questions
What version of Node.js does TokenTracker require?
The TokenTracker CLI requires Node.js 20 or newer. Check with node --version before running npx tokentracker-cli or installing the package globally.
Which operating systems can run the TokenTracker CLI?
The documented Node.js CLI runs on macOS, Linux, and Windows. TokenTracker also publishes native desktop packages, but those are optional alternatives to the CLI workflow.
What URL and port does TokenTracker use?
The documented dashboard address is http://localhost:7680. Verify that exact address locally before configuring an HTTP tunnel to port 7680.
Does TokenTracker read prompts or conversations?
TokenTracker states that it tracks token counts and does not read prompts or conversation content. However, dashboard analytics such as project attribution, activity times, model selection, costs, and usage totals can still be sensitive and should be protected accordingly.
Do I need an account or provider API key to run the local dashboard?
The documented local-first workflow does not require a TokenTracker account or provider API keys. TokenTracker reads supported local usage sources. Optional cloud-related functionality is separate from the local setup described here.
Is the TokenTracker dashboard secure to expose publicly by default?
This guide cannot make that claim. The available project information does not establish built-in dashboard authentication or authorization for this deployment. HTTPS transport does not replace access control. Use an appropriate authentication layer or keep the tunnel temporary and controlled.
Why does Localtonet need to run on the same machine?
It is not an absolute requirement, but it is the simplest arrangement. When our client and TokenTracker run on the same host, the client can target the verified loopback service on port 7680. If the client runs elsewhere, that device must have a valid network route to the TokenTracker service.
Does creating a Localtonet tunnel make it active immediately?
No. Creating a tunnel and running it are separate lifecycle actions. Press Start after creating and reviewing the tunnel. You can stop it when remote access is not needed and delete it when the configuration will not be reused.
Will the public URL continue working after TokenTracker closes?
No. The tunnel needs a responding local target. Remote access also depends on the selected Localtonet client remaining connected and the tunnel remaining started.
Connect your verified TokenTracker dashboard with Localtonet
Start TokenTracker locally, confirm that http://localhost:7680 works, decide how the dashboard will be protected, and then create a controlled HTTP tunnel from the device that can reach it.