

Measure the model, runtime, stream, client, and network before changing your configuration
A slow remote LLM endpoint does not automatically mean the tunnel is slow. Model loading, memory pressure, prompt evaluation, token generation, request queues, response buffering, DNS, connection setup, TLS negotiation, and the remote network can each create a different delay. This guide provides a reproducible, runtime-neutral procedure for measuring those stages with a fixed payload and safe placeholder-based curl commands. It also shows how to compare a local inference API with a Localtonet HTTP tunnel without attributing every localhost-to-remote difference to the tunnel.
📋 What's in this guide
Start with the complete request path
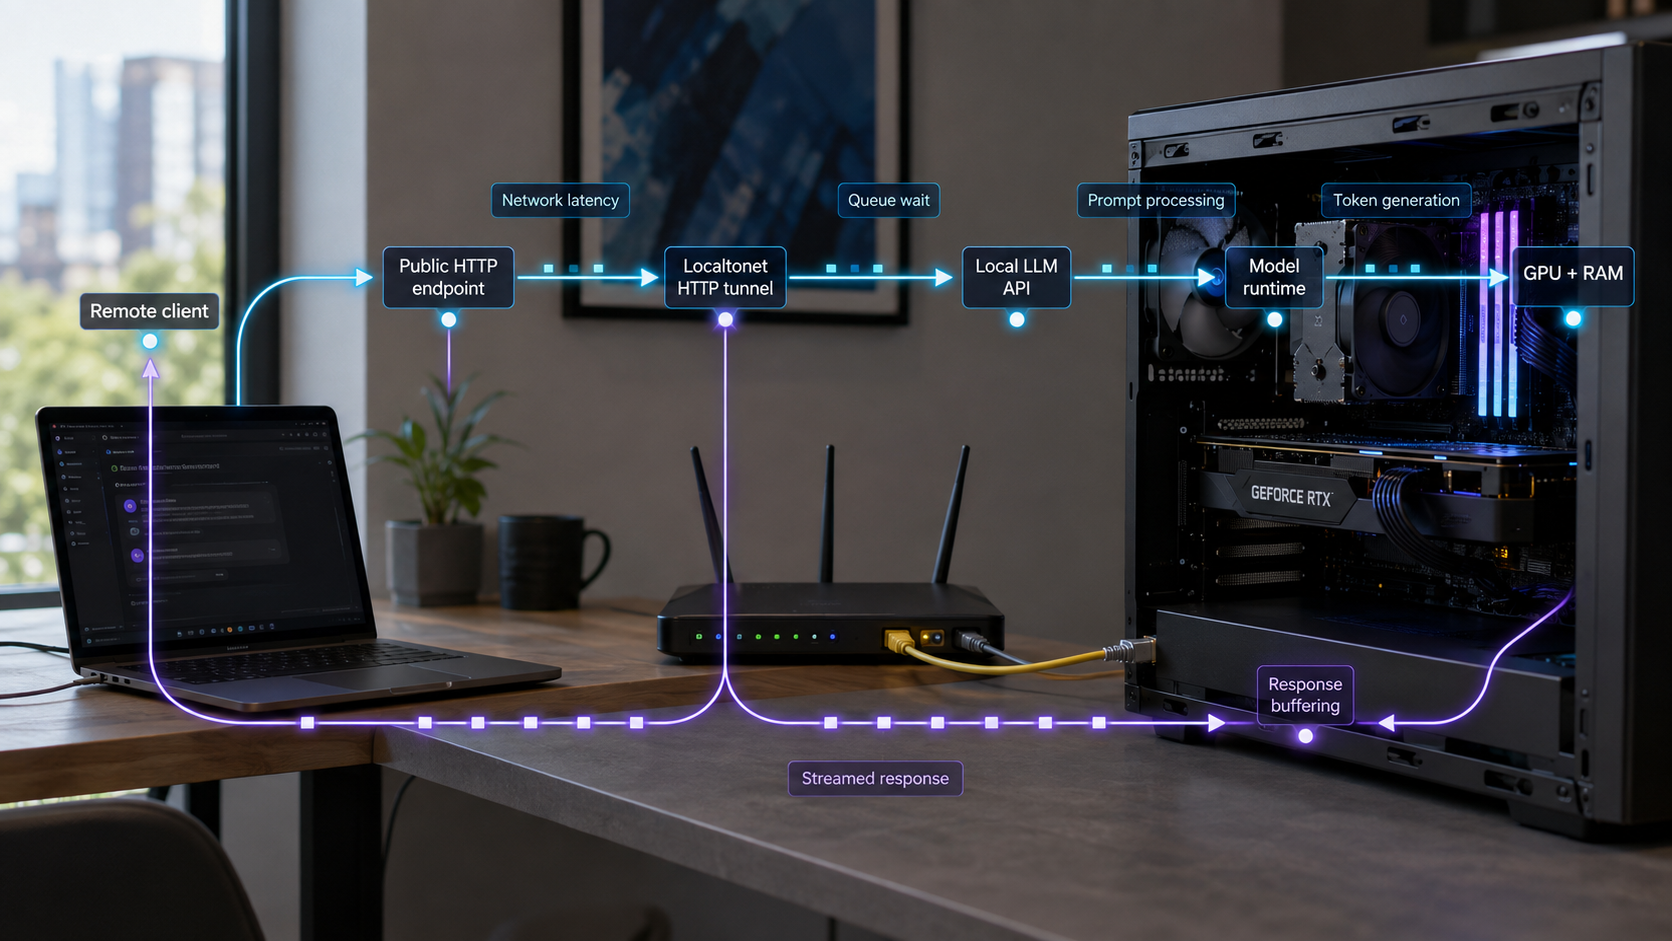
A remote inference request crosses several independently measurable stages. The client may perform a DNS lookup, establish a TCP connection, negotiate TLS, upload the request, wait while the application queues and processes it, and then receive response headers and body bytes. Inside the model runtime, the request may trigger model loading, prompt evaluation, token generation, or a wait behind another request. Finally, the server, an intermediary, or the client may buffer streamed data.
The correct troubleshooting question is not simply, “How long did the request take?” It is, “Where did the elapsed time accumulate?” A 30-second request that produces nothing for 25 seconds has a different bottleneck from one that starts in one second and then generates slowly for 29 seconds. A third request might finish inference quickly but remain invisible because the client buffers the response.
Use precise latency terms
Time to first byte and time to first generated token are not interchangeable. Time to first byte, or TTFB, is the interval from the beginning of the client operation until the first response byte becomes available to that client. It can include DNS, connection setup, TLS, request upload, queueing, server processing, and the return path.
Time to first generated token, or TTFT, is the interval from request submission until the first actual model-generated token is available. An HTTP response may send headers, an opening JSON object, a server-sent event comment, or metadata before it sends a generated token. In those cases, TTFB is lower than TTFT. A generic HTTP client can measure the first response byte, but it cannot reliably identify the first generated token without understanding the API's response framing.
Generation rate should also exclude prompt evaluation when possible. If a runtime reports generated-token count and generation duration, calculate:
generation_tokens_per_second = generated_token_count / generation_duration_secondsIf native generation duration is unavailable, use the interval from the first generated token to the final generated token:
estimated_generation_tokens_per_second =
  generated_tokens_after_first / seconds_between_first_and_final_generated_token
Dividing generated tokens by the entire HTTP request duration mixes network setup, queueing, prompt evaluation, and decoding. It can be useful as an end-to-end throughput figure, but it is not a clean model generation rate.
Some runtimes report prompt-token count, generated-token count, prompt-evaluation duration, generation duration, load duration, or total duration. Use those documented native values instead of estimating inference phases from wall-clock time. Check the reported units before calculating rates. Native counters describe the runtime's work, while client timings describe the user's end-to-end experience. Keep both because they answer different questions.
Prepare a reproducible test environment
Do not start by changing the model, quantization, context limit, tunnel, and client simultaneously. Prepare one stable workload and record enough configuration data to reproduce it. The commands below are intentionally runtime-neutral. Replace every placeholder with values from your own model server documentation.
Required prerequisites
- A functioning local HTTP inference API: verify the actual listener address, port, generation route, request schema, and model identifier.
- A fixed test payload: save one small diagnostic prompt and, ideally, one representative production-sized prompt as JSON files.
- A streaming-capable client: use a current curl build or another client that can display response bytes without waiting for the complete body.
- Host monitoring access: be able to inspect runtime logs, process state, CPU, accelerator, memory, storage, and network activity.
- Controlled model state: know how your runtime loads, unloads, or restarts a model so cold and warm trials can be labeled correctly.
- A Localtonet account and connected client: this is required for the public HTTP comparison. Register through the Localtonet account page.
- An authentication plan: if the model API does not authenticate callers, place a supported authenticated gateway in front of it before allowing untrusted remote access.
Define placeholders without exposing secrets
The following shell variables make the examples reusable. They do not contain a real model name, port, route, public hostname, or credential. Avoid pasting secrets directly into shared shell history or benchmark output.
export LOCAL_BASE='http://127.0.0.1:<LOCAL_PORT>'
export PUBLIC_BASE='https://<ASSIGNED_PUBLIC_HOST>'
export HEALTH_PATH='<HEALTH_OR_STATUS_PATH>'
export GENERATE_PATH='<GENERATION_PATH>'
export PAYLOAD_FILE='./benchmark-request.json'
export RESULTS_DIR='./llm-benchmark-results'

mkdir -p "$RESULTS_DIR"
Create the request body using the exact field names documented by your runtime. The following is a structural template, not a claim that every API accepts these properties:
{
  "model": "<MODEL_IDENTIFIER>",
  "prompt": "<FIXED_TEST_PROMPT>",
  "stream": true,
  "<DOCUMENTED_OUTPUT_LIMIT_FIELD>": <FIXED_OUTPUT_LIMIT>
}
If your runtime requires an authorization header, add it using the mechanism documented by that runtime or gateway. Do not store a production token in the payload file, article, screenshots, or results worksheet.
Verify local correctness before measuring speed
Use a documented health, status, or model-list route if the runtime provides one:
curl --fail-with-body --silent --show-error \
  "$LOCAL_BASE/$HEALTH_PATH"
A connection refusal means no reachable listener answered at that address and port. An HTTP error means a listener did answer, so inspect the status, response body, request route, authentication, and server logs. A successful health check does not prove that generation works, so also submit the fixed request:
curl --fail-with-body --silent --show-error \
  --request POST \
  --header 'Content-Type: application/json' \
  --data-binary "@$PAYLOAD_FILE" \
  "$LOCAL_BASE/$GENERATE_PATH" \
  --output "$RESULTS_DIR/local-response.json"
Run this command on the model host first. Address the service using the listener that actually exists. A service bound only to loopback can be reached by a Localtonet client running on that same host when the tunnel target uses the corresponding loopback address. If the Localtonet client runs on another device, that device must be able to reach the selected local IP address and port.
Binding an unauthenticated model API to every network interface can expose it to other devices on the LAN. Keep the narrowest listener compatible with your architecture, and add authentication before allowing access from untrusted clients.
Maintain a benchmark record
Record configuration and workload state alongside every result. A comparison is not valid if the model, runtime version, context, output size, concurrency, or client location changed without being noted.
| Field | Value to record | Why it matters |
|---|---|---|
| Model | Exact model identifier | Different models have different memory and compute requirements |
| Runtime version | Exact server/runtime version | Updates can change scheduling, kernels, metrics, and streaming |
| Quantization | Exact format or level | It can affect memory use and performance |
| Context size | Configured limit and actual submitted size when available | Prompt evaluation and memory demand grow with context |
| Input tokens | Runtime or tokenizer count | Character count is not a reliable substitute |
| Output tokens | Actual generated count | Total time depends on output length |
| State | Cold or warm | Cold trials may include loading and initialization |
| Concurrency | Number of overlapping generation requests | Queues and resource sharing can alter every timing |
| HTTP result | Status code and relevant error category | A fast error is not a successful inference result |
| First-token time | Seconds to first generated token | Separates startup and prompt delay from decoding |
| Generation rate | Generated tokens per second | Measures decode performance when calculated correctly |
| Total time | End-to-end completion time | Represents the complete user wait |
| Client location | Host-local, LAN, or named remote network | Network path and client behavior differ by origin |
Measure DNS, connection, TLS, upload, first byte, and completion
curl can report transport milestones independently of the response body. The curl project documents these variables in its official curl command-line manual. Check your installed curl version because newer timing variables may not exist in older builds.
Create a reusable timing format
cat > curl-timing.txt <<'EOF'
http_code=%{http_code}
remote_ip=%{remote_ip}
num_connects=%{num_connects}
dns_seconds=%{time_namelookup}
connect_at_seconds=%{time_connect}
tls_at_seconds=%{time_appconnect}
pretransfer_at_seconds=%{time_pretransfer}
upload_finished_at_seconds=%{time_posttransfer}
first_byte_at_seconds=%{time_starttransfer}
total_seconds=%{time_total}
uploaded_bytes=%{size_upload}
downloaded_bytes=%{size_download}
upload_bytes_per_second=%{speed_upload}
download_bytes_per_second=%{speed_download}
EOF
If curl reports that time_posttransfer is unknown, remove that line. Older curl versions cannot isolate request upload completion with this method. In that case, retain the other values and use server-side request-start timing to help separate upload from processing.
Capture a local request
curl --fail-with-body --silent --show-error \
  --request POST \
  --header 'Content-Type: application/json' \
  --data-binary "@$PAYLOAD_FILE" \
  --output "$RESULTS_DIR/local-body.json" \
  --write-out "@curl-timing.txt" \
  "$LOCAL_BASE/$GENERATE_PATH" \
  | tee "$RESULTS_DIR/local-timing.txt"
Interpret the curl timestamps
Most curl timing fields are cumulative seconds from the beginning of the operation. Subtract adjacent milestones to estimate stage duration:
DNS lookup                  = time_namelookup
TCP connection setup         = time_connect - time_namelookup
TLS negotiation              = time_appconnect - time_connect
Pre-transfer setup after TLS = time_pretransfer - time_appconnect
Request upload               = time_posttransfer - time_pretransfer
Upload-to-first-byte wait    = time_starttransfer - time_posttransfer
Response download            = time_total - time_starttransfer
For a plain HTTP local URL, TLS is not performed and time_appconnect may be zero. For HTTPS, the TLS calculation is most useful on a fresh connection. Connection reuse can legitimately make setup fields zero or much smaller, so also record num_connects and distinguish fresh-connection tests from keep-alive tests.
The upload-to-first-byte interval is not pure model time. It can include relay and return-path transit, application queueing, request parsing, prompt evaluation, response preparation, and the travel time of the first response byte. This is why server-side timing correlation and runtime-native metrics are necessary.
time_starttransfer identifies when curl receives the first response byte. If the API emits headers or metadata before generated content, this value is not time to first token. Use a response-aware parser or runtime metric for TTFT.
Run repeated warm trials
First send one unrecorded warm-up request if your goal is steady-state performance. Then run several non-overlapping trials. The loop below produces separate body and timing files:
for run in 1 2 3 4 5; do
  curl --fail-with-body --silent --show-error \
    --request POST \
    --header 'Content-Type: application/json' \
    --data-binary "@$PAYLOAD_FILE" \
    --output "$RESULTS_DIR/local-warm-$run.body" \
    --write-out "@curl-timing.txt" \
    "$LOCAL_BASE/$GENERATE_PATH" \
    > "$RESULTS_DIR/local-warm-$run.timing"
done
Do not average cold and warm trials together. Report the median and range of the warm trials, and keep cold-start results as a separate category. A median is often more useful than a mean when one request contains an unusual initialization or network delay.
Run cold trials deliberately
A cold trial must begin from a defined state. Depending on the runtime, that might mean the model is unloaded, the process is restarted, or the host is restarted. Use only the runtime's documented lifecycle controls. Do not assume that closing a chat window unloads the model.
- Return the runtime to the chosen documented cold state.
- Confirm that no warm-up or health request automatically loads the model.
- Send exactly one recorded generation request.
- Save client timing, runtime metrics, logs, and host utilization.
- Repeat the complete reset before the next cold trial.
Cold trials are intentionally not automated here because restart and unload commands are runtime-specific. Guessing them could terminate unrelated processes or fail to create a genuinely cold state.
Diagnose model-loading and context-memory pressure
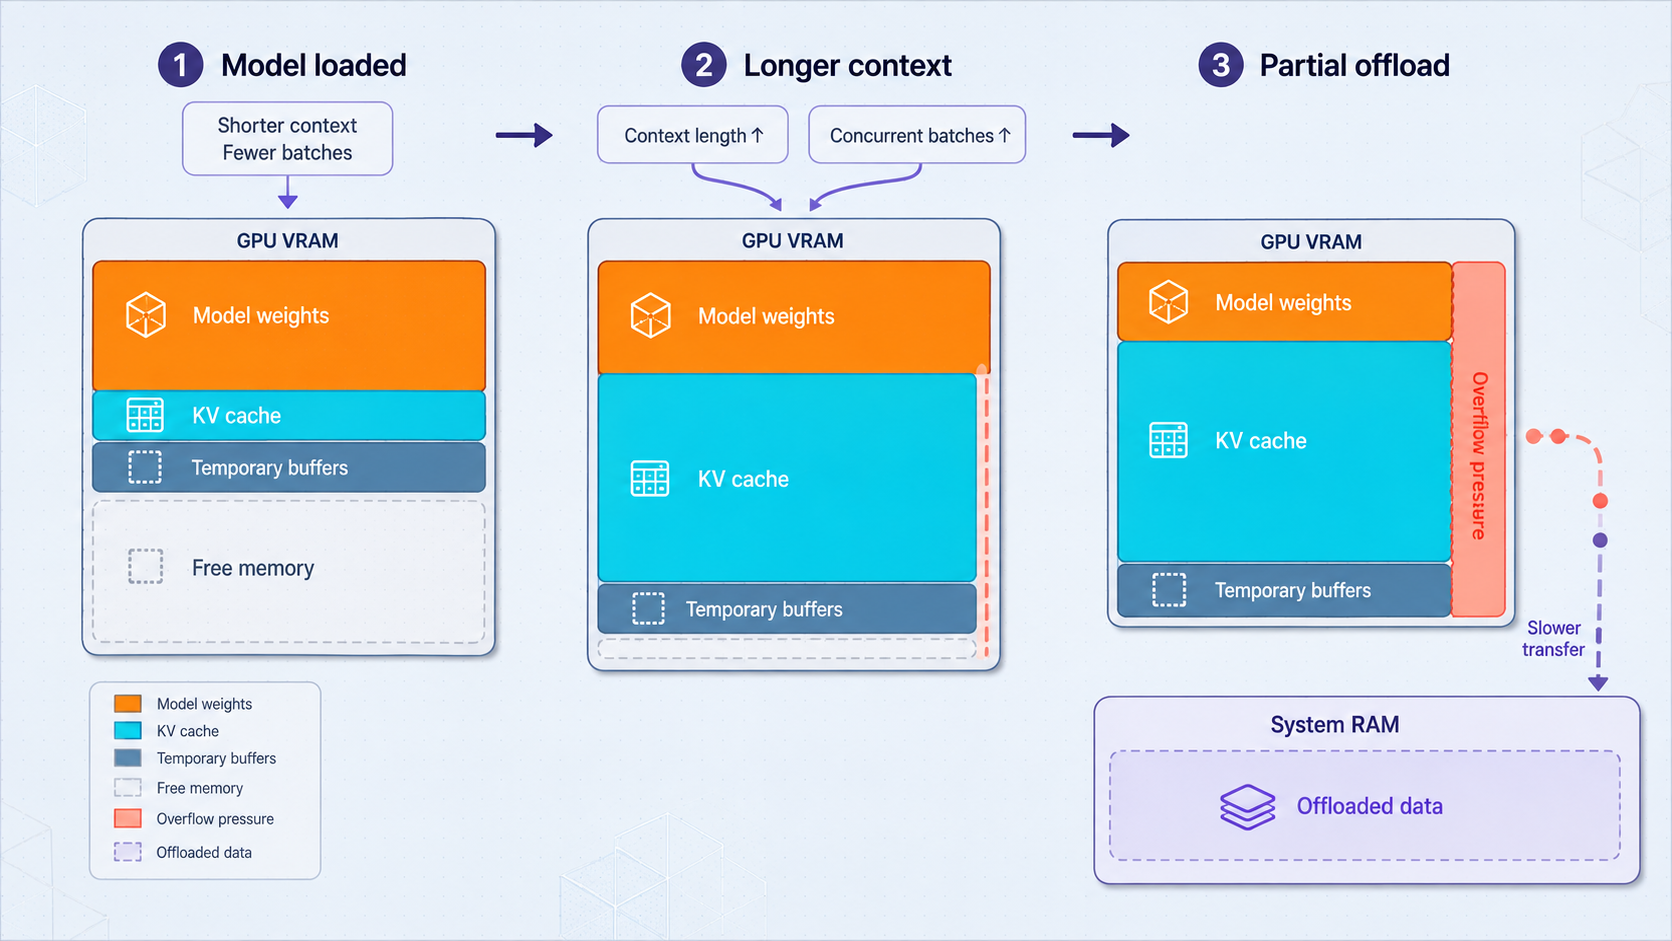
Local inference has a capacity boundary. The runtime needs memory for model weights, execution overhead, request state, and context-related data. Concurrent sessions can increase the total requirement. A parameter count or model file size alone is not a complete memory estimate because formats, runtimes, context limits, and execution strategies differ.
A Localtonet HTTP tunnel carries requests to the existing service. It does not resize the model, add host memory, change the inference runtime, or provide inference compute. If the model cannot load locally, is repeatedly terminated, or becomes unusable under paging pressure, the same service will remain unhealthy through its public URL.
Recognize capacity failures
Look for explicit allocation failures, a process that exits while loading, operating-system termination events, repeated runtime restarts, or a model that never reaches a ready state. If the process remains alive but responsiveness collapses, observe whether the system is paging or swapping heavily. Use runtime and operating-system evidence rather than diagnosing memory pressure from a remote timeout alone.
Separate weights from context growth
A model may load successfully with a short prompt and fail during a long conversation. Applications often resend system instructions, conversation history, retrieved documents, tool descriptions, and structured schemas with each turn. Inspect the actual HTTP request rather than only the newest text visible in the chat box.
Compare a fresh conversation with a long conversation while keeping the current question and output limit fixed. Use the runtime's tokenizer or request metrics to obtain prompt-token count where available. Character count is only an approximation because tokenization depends on the model and content.
Confirm the diagnosis with controlled reductions
Change one factor at a time. Test a shorter prompt, fewer concurrent requests, a smaller supported context setting, or a smaller or more aggressively quantized model supported by the runtime. Repeat the original condition after any apparent improvement. Do not claim success from a single warm request after changing several variables.
A longer timeout may allow a legitimately slow batch request to complete. It cannot correct a failed allocation, process termination, repeated restart, or severe paging. Establish local model health before increasing client timeouts.
Measure prompt evaluation and token generation separately
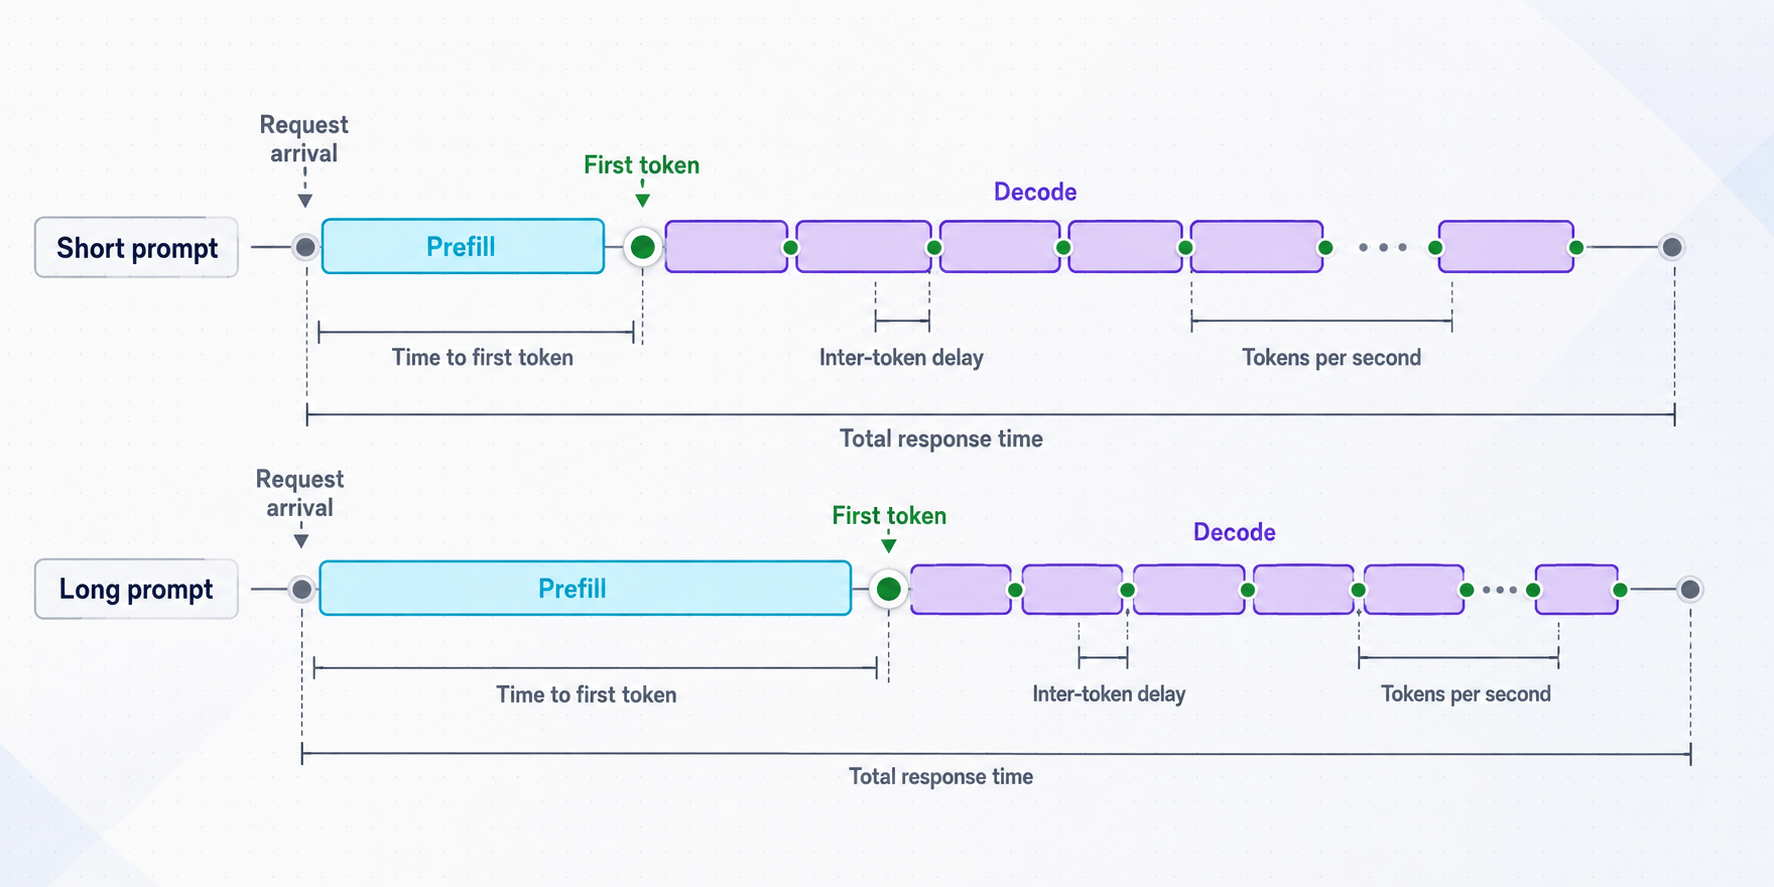
Model inference has at least two user-visible phases. During prompt evaluation, sometimes called prefill, the runtime processes the submitted context. During decoding, it produces generated tokens. Hardware, prompt length, quantization, runtime configuration, and concurrency can affect these phases differently.
The distinction between prompt processing and subsequent-token generation is documented by inference frameworks and hardware vendors because these phases exercise systems differently. Treat any runtime-specific interpretation as dependent on that runtime's implementation and version.
Use native counters before wall-clock estimates
If the response or server log reports prompt token count, prompt-evaluation duration, generated token count, generation duration, or load duration, preserve those raw values. Confirm whether durations are expressed in seconds, milliseconds, microseconds, or nanoseconds. Then calculate:
prompt_evaluation_rate =
  prompt_token_count / prompt_evaluation_duration_seconds

generation_rate =
  generated_token_count / generation_duration_seconds
Native generation rate should be compared across identical model, quantization, runtime, context, output, and concurrency conditions. It is not directly interchangeable with client-observed throughput because the client also sees queues and network delivery.
Investigate high first-token time
If connection setup and request upload are quick but generated content begins late, compare cold and warm trials. A large cold-only delay points toward model loading or initialization. If every trial slows as input tokens increase, prompt evaluation or context-related memory pressure is a stronger candidate. If delay appears only under overlap, queueing or batching is likely involved.
Compare several controlled prompt sizes while fixing the requested output limit. Record native prompt-token counts rather than assuming equal character lengths represent equal token counts.
Investigate slow output after the first token
If generated output begins promptly but continues slowly, focus on decode performance. Measure native generation duration and generated-token count if the runtime provides them. Otherwise, use a response-aware streaming parser to timestamp the first and final generated tokens.
Slow decoding can reflect a demanding model, unsuitable runtime configuration, resource contention, thermal or power limits, or concurrent inference. Compare an otherwise idle host with the normal workload, introducing only one competing workload at a time.
Control actual output length
A request that emits 500 tokens is not comparable to one that emits 50. Fix the requested maximum and record the actual generated count. Also distinguish a normal stop condition from a client timeout, canceled request, malformed stream, or broken connection.
| Observed pattern | Next controlled test | Likely interpretation |
|---|---|---|
| First request slow, later requests fast | Repeat a documented cold reset and one-request trial | Loading or initialization contributes |
| Long prompts delay generated output | Vary input tokens while fixing output length | Prompt evaluation or context pressure contributes |
| First token fast, later tokens slow | Measure native generation duration while idle | Decode performance is the main candidate |
| Long conversations degrade | Compare the full payload with a fresh conversation | Accumulated context may be involved |
| Runtime generation rate is stable but remote display is slow | Timestamp streamed chunk arrival and client rendering | Delivery or client behavior is more likely |
Determine whether streaming is incremental or buffered
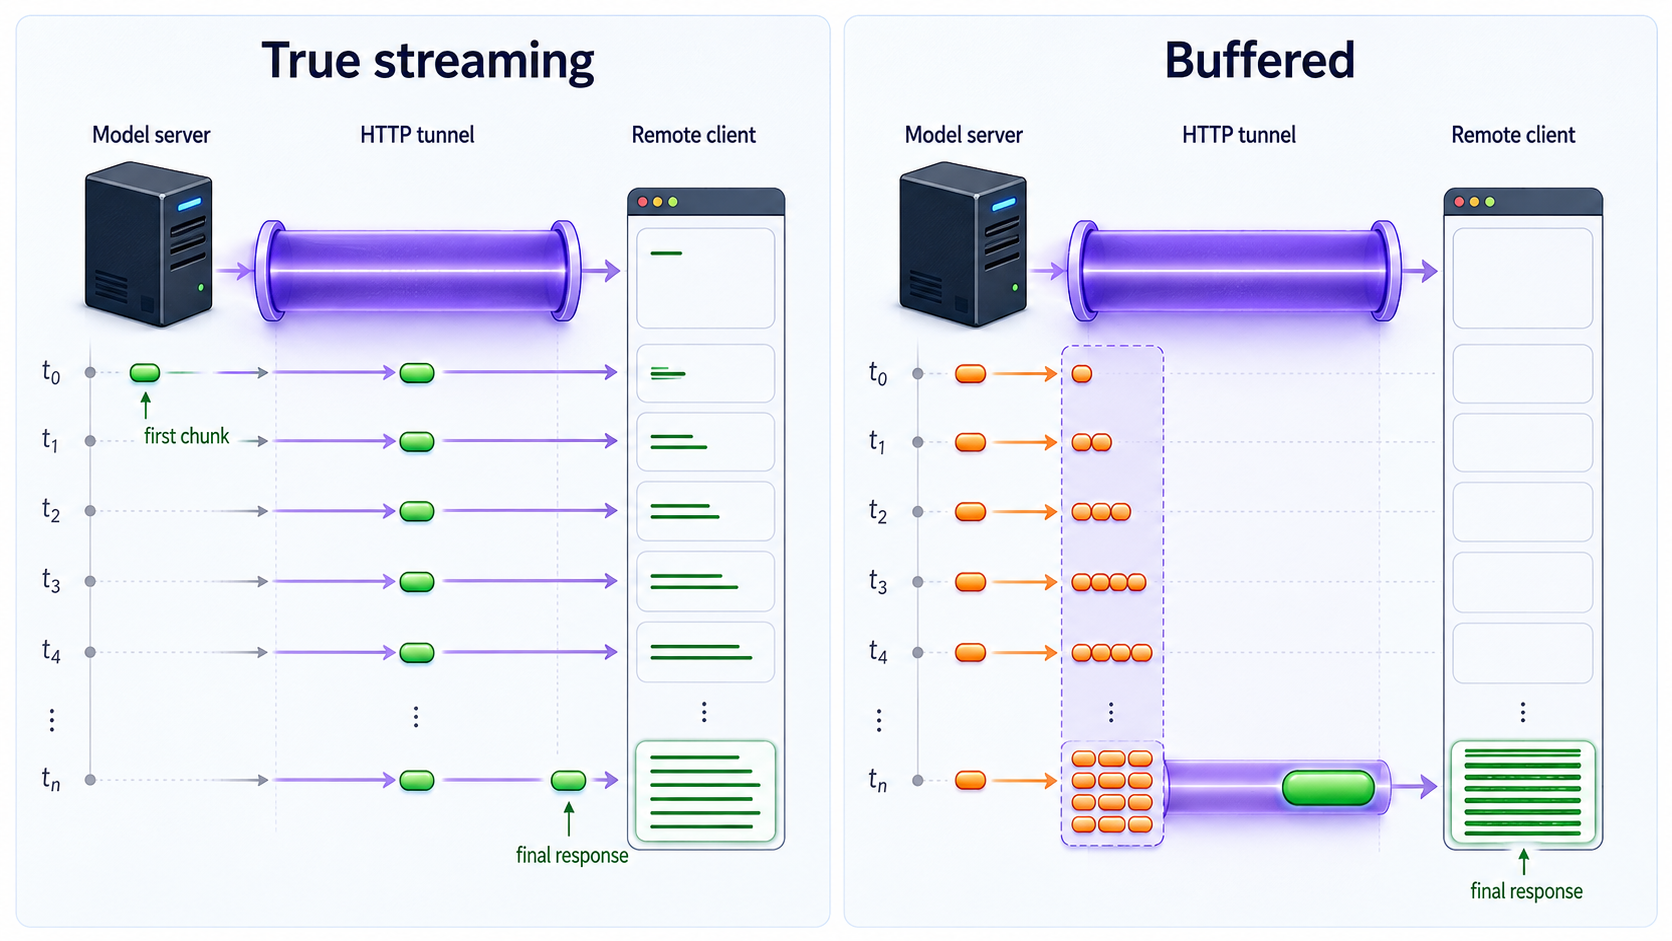
Streaming improves perceived responsiveness by displaying output before generation completes. It does not increase model capacity or inherently raise the runtime's generation rate. Streaming behavior depends on the request mode, server implementation, response format, intermediaries, and client.
Use unbuffered curl output
curl's --no-buffer, or -N, disables curl's normal output buffering. Send the same fixed payload to the local endpoint:
curl --fail-with-body --show-error --no-buffer \
  --request POST \
  --header 'Content-Type: application/json' \
  --data-binary "@$PAYLOAD_FILE" \
  "$LOCAL_BASE/$GENERATE_PATH" \
  | tee "$RESULTS_DIR/local-stream.body"
This confirms whether bytes become visible incrementally. It does not prove that every visible chunk is a generated token. The API might send event framing, keepalive data, role metadata, or an opening object first.
Timestamp received data
curl can add timestamps to a protocol trace. Traces may contain request and response data, so use only a nonsensitive fixture and protect the output:
curl --fail-with-body --no-buffer \
  --request POST \
  --header 'Content-Type: application/json' \
  --data-binary "@$PAYLOAD_FILE" \
  --trace-time \
  --trace-ascii "$RESULTS_DIR/local-stream.trace" \
  "$LOCAL_BASE/$GENERATE_PATH" \
  --output "$RESULTS_DIR/local-stream.raw"
Inspect the trace for the arrival pattern of response data. Several chunks arriving with nearly identical timestamps after a long silence can indicate buffering. Small chunks arriving continuously but slowly point more strongly toward slow generation or deliberate server pacing.
Protocol traces may capture headers, credentials, prompts, and model output. Use a synthetic benchmark prompt, avoid exposing credentials where possible, restrict access to trace files, and delete them when the investigation is complete.
Measure actual first-token time correctly
To obtain TTFT, parse the API's documented stream format and timestamp the first event that contains generated text or a generated token. The parser must ignore headers, comments, metadata, role markers, and empty deltas. Because event schemas differ, there is no safe universal curl-only expression for this step.
If the runtime directly reports a first-token or prompt-evaluation duration, use it for inference analysis. Use client-observed TTFT to capture the complete user experience. The difference between those values can contain queueing, network transit, intermediary handling, serialization, and client parsing.
Confirm the runtime's documented streaming mode and framing. A changing interface indicator is not proof that generated content is arriving incrementally. Test the API directly before diagnosing a browser or chat interface.
Test queues and concurrent requests deliberately
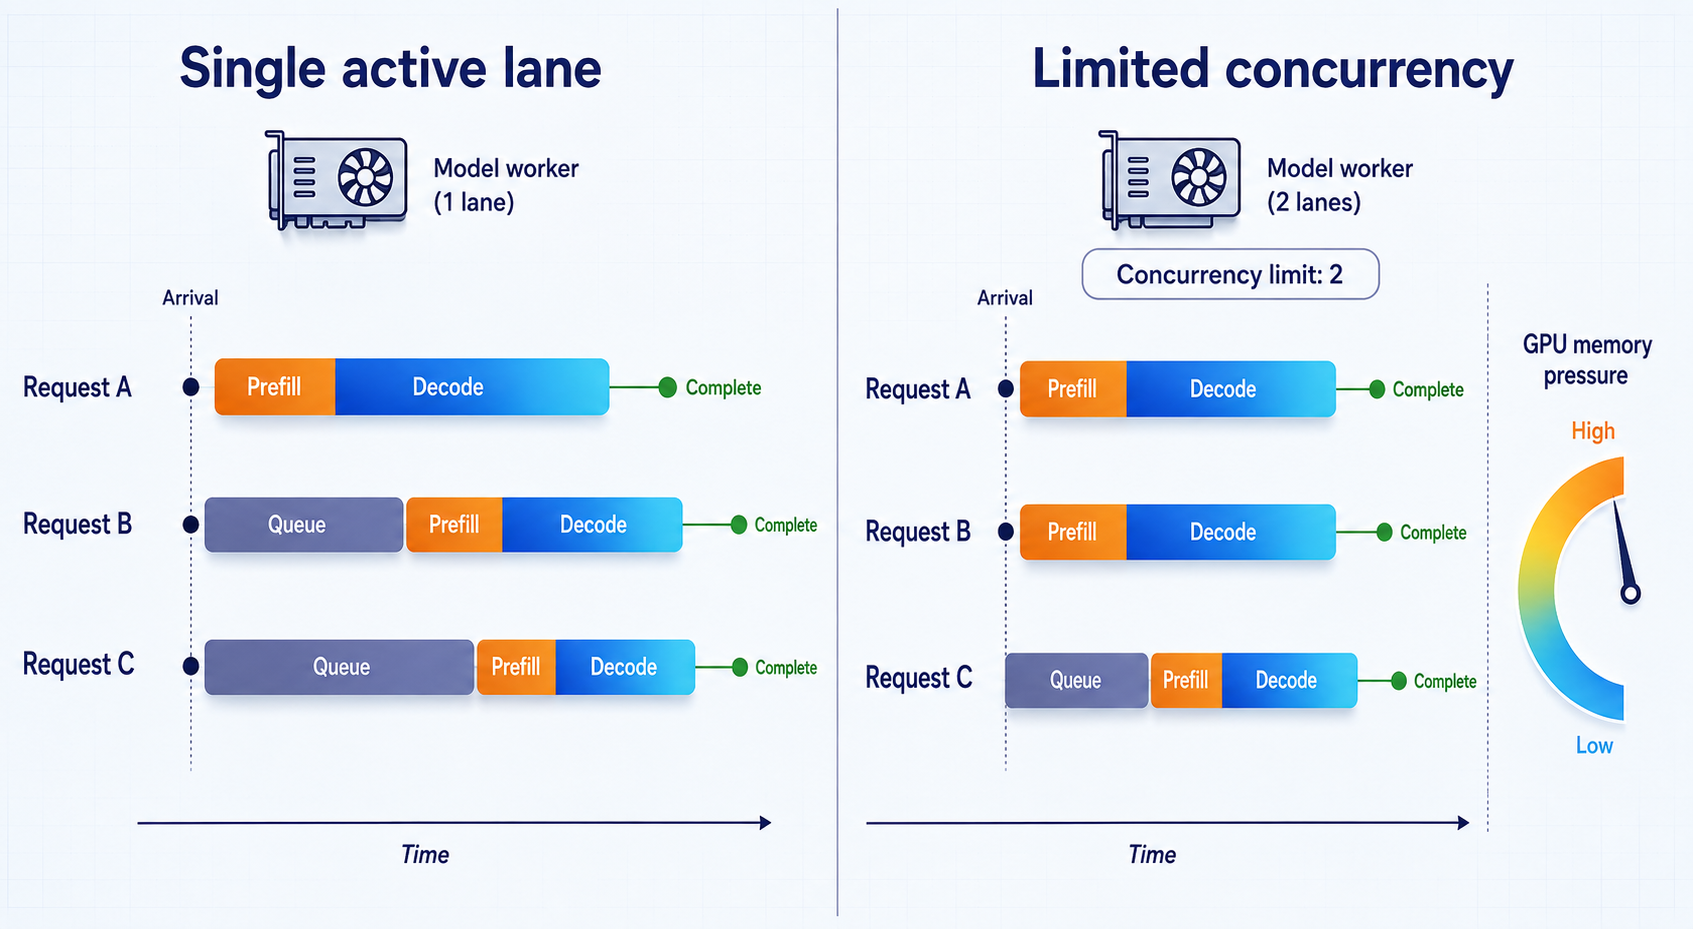
One successful request proves basic functionality, not multi-user capacity. A runtime may serialize generation, batch work, or process requests concurrently. An HTTP server can accept simultaneous connections even when the model worker handles only one inference request at a time.
Establish a stable one-request warm baseline. Then submit two identical requests simultaneously and save their results independently:
for run in 1 2; do
  curl --fail-with-body --silent --show-error \
    --request POST \
    --header 'Content-Type: application/json' \
    --data-binary "@$PAYLOAD_FILE" \
    --output "$RESULTS_DIR/concurrent-$run.body" \
    --write-out "@curl-timing.txt" \
    "$LOCAL_BASE/$GENERATE_PATH" \
    > "$RESULTS_DIR/concurrent-$run.timing" &
done
wait
Compare each request's submission, first byte, first generated token, native prompt and generation durations, completion, and status. If one request remains normal while the other waits, serialization or queueing may be occurring. If both generate more slowly, they may be sharing compute or memory bandwidth. If the runtime becomes unstable, aggregate memory demand may be too high.
Watch for hidden concurrency
Automated retries, agent loops, health checks, browser tabs, and chat interfaces can create overlapping work. A retry is particularly costly when the original request continues running, because one perceived timeout becomes two active generation jobs.
Correlate client timestamps with server logs. Use a nonsecret request identifier if the application supports one, but do not place credentials or private prompt content in identifiers. Apply appropriate access controls and retention to operational logs.
Use a deliberate overload policy
Predictable queueing or explicit rejection can be safer than accepting unlimited work and degrading every session. Queue, worker, batch, cancellation, and concurrency controls are runtime-specific. Use only settings documented for the installed runtime version.
Compare local inference with a Localtonet HTTP tunnel
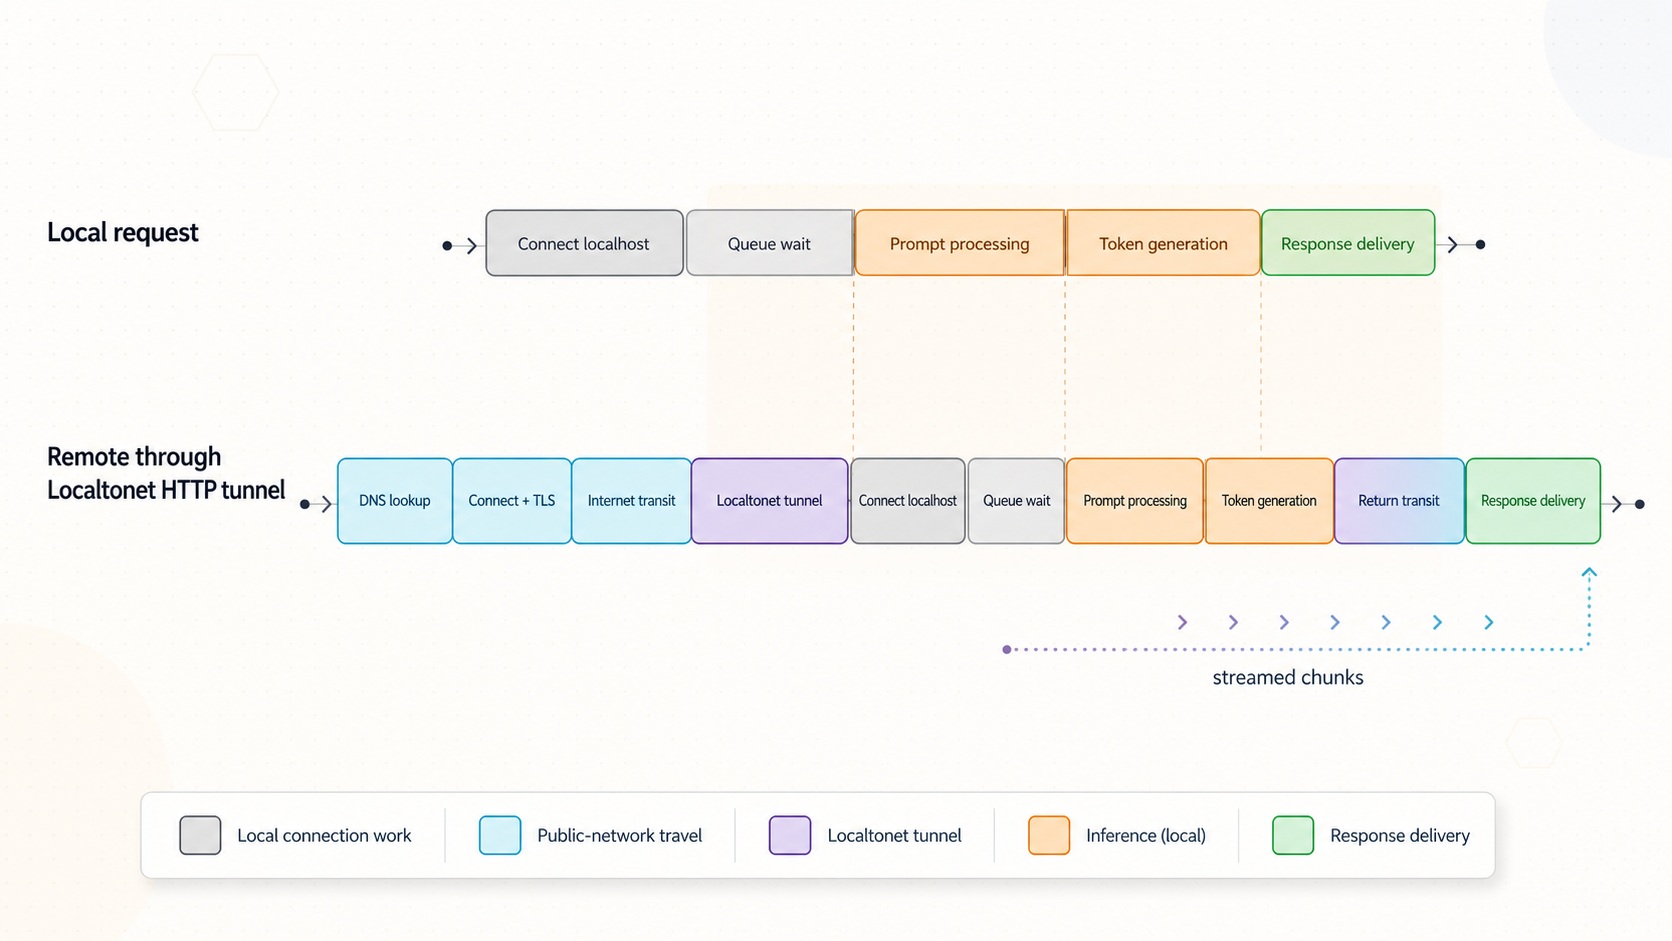
Once the local API is healthy and measured, add remote access as a separate layer. The Localtonet client on a device that can reach the model service establishes an outbound connection to our relay. This provides a public endpoint without inbound router port forwarding, firewall changes, VPN setup, or a public IP address.
An HTTP tunnel points to the local IP address and port of the verified model API. HTTP tunnels can use Random Sub Domain, Custom Sub Domain, or Custom Domain process types. Current availability and domain configuration can vary, so use the options shown in your dashboard. Select a current relay server or region from the product rather than copying a hardcoded server code.
Configure the HTTP tunnel in the documented sequence
Create or sign in to your Localtonet account
Use your Localtonet account to manage the device and tunnel. If needed, create an account on the Localtonet registration page.
Install and run the Localtonet client
Install the current client for the model host's operating system, or on another device that can reach the verified API listener. OS-specific installation commands are not included here because no current commands are available in the supplied verified evidence. Use the installation guidance linked from the current Localtonet HTTP tunnel documentation rather than an old command copied from another article.
Authenticate and select the connected device
Select the device-specific authentication token for the client that will carry the tunnel. Confirm that the device is connected. Treat its token as a credential and keep it out of commands, screenshots, logs, prompts, and benchmark files.
Select an available relay server
Choose a server or region currently offered in the Localtonet dashboard. Do not hardcode a value from an unrelated setup because available choices can vary.
Create the HTTP tunnel configuration
Select the required process type and enter the local IP address and port already proven by the local API test. If the Localtonet client runs on the model host, the target may be the model's loopback listener. If it runs elsewhere, the target must be reachable from that device.
Start the tunnel
Creating a tunnel does not start it. Use the Start button and confirm that the selected client remains connected. The public URL is available only while the client is connected and the tunnel is running.
Verify the public HTTPS endpoint
Use the assigned public URL with the same API path, payload, headers, and streaming mode used for the local baseline. Confirm the expected HTTP status and response before beginning performance comparisons.
Stop or delete access when finished
Stop the tunnel when remote access is not required. Delete configurations that are no longer needed. Stopping the tunnel removes the public route but does not replace application authentication while the tunnel is active.
See the Localtonet HTTP tunnel documentation for the current interface and installation path. This guide does not guess an installation command, relay code, API port, or custom-domain DNS record.
Verify the public endpoint with the same payload
curl --fail-with-body --silent --show-error \
  --request POST \
  --header 'Content-Type: application/json' \
  --data-binary "@$PAYLOAD_FILE" \
  --output "$RESULTS_DIR/public-body.json" \
  --write-out "@curl-timing.txt" \
  "$PUBLIC_BASE/$GENERATE_PATH" \
  | tee "$RESULTS_DIR/public-timing.txt"
Test public streaming separately:
curl --fail-with-body --show-error --no-buffer \
  --request POST \
  --header 'Content-Type: application/json' \
  --data-binary "@$PAYLOAD_FILE" \
  "$PUBLIC_BASE/$GENERATE_PATH" \
  | tee "$RESULTS_DIR/public-stream.body"
Use three comparison levels instead of one misleading A/B test
A request from curl on the model host to 127.0.0.1 and a request from a laptop on another network to a public HTTPS URL differ in client hardware, software, DNS, TCP, TLS, wireless conditions, internet route, and tunnel path. Their difference cannot be assigned entirely to Localtonet.
| Comparison | What to hold constant | What it reveals |
|---|---|---|
| Host-local baseline | Model, payload, runtime state, concurrency, client command | Minimum end-to-end behavior without a remote network path |
| Same-client LAN versus public | Use one client device, one payload, one warm model, and non-overlapping requests | More directly compares local network access with the public path when LAN testing is possible |
| Server-side timing correlation | Match request identifiers and timestamps across local and public tests | Shows whether extra time occurred before server receipt, in the queue, during inference, or after server output |
| Multiple remote networks | Keep endpoint, payload, model state, and client software stable | Identifies location-specific wireless, ISP, mobile, or route effects |
Start with the host-local baseline because it establishes model health. Where safe and technically possible, use the same remote client to call both a LAN address and the public URL. Do not expose the LAN listener more broadly merely to enable this test. If a same-client LAN test is unavailable, disclose that limitation rather than calling the comparison a clean tunnel-overhead measurement.
Correlate both requests with server-side logs or native runtime metrics. If prompt-evaluation and generation durations are stable but client TTFB changes, focus on the path before or after inference. If native prompt or generation duration changes too, model state, queueing, concurrency, or host contention also changed.
The remote test includes a different origin and usually a different network path. Attribute delay to a specific layer only when controlled measurements and server-side correlation support that conclusion.
Protect a remotely reachable LLM API
A public HTTPS address encrypts transport to the tunnel edge, but HTTPS does not by itself authenticate the caller or authorize model operations. If the underlying application accepts every request, publishing it at an HTTPS URL does not add application authentication.
A practical architecture is to place a supported authenticated gateway or application proxy in front of an otherwise unauthenticated model API. Point the Localtonet HTTP tunnel at that gateway, not directly at the model listener. The gateway should verify callers, authorize permitted routes, apply request and concurrency limits, and forward only approved traffic to the model server.
Remote client
  -> Localtonet public HTTPS endpoint
  -> authenticated gateway on the local device
  -> loopback-only model inference API
The gateway must be a product and configuration you operate and support. Do not assume that an arbitrary reverse proxy provides authentication safely without explicit configuration. Test denial behavior as well as successful access.
Apply controls at the correct layer
Protect tool-enabled agents more strictly
A text-generation route consumes compute. A tool-enabled agent may also read files, access private services, send messages, modify data, or execute actions. Authenticate both the remote caller and downstream tools. Scope tool permissions narrowly, validate inputs, separate read and write capabilities where possible, and require human approval for consequential operations.
Do not give the model process unrestricted host access merely because the endpoint itself is authenticated. A compromised credential, prompt injection, unsafe tool, or application vulnerability can still act within the permissions granted to the process.
Test security controls explicitly
- Send a request without credentials and verify that it is rejected before inference begins.
- Send invalid credentials and confirm that logs do not expose the submitted secret.
- Attempt a route that the remote role should not use and confirm that authorization blocks it.
- Exceed a safe test limit and verify predictable rejection rather than unlimited queue growth.
- Confirm that access stops when the Localtonet tunnel is stopped.
Troubleshooting matrix by symptom
| Symptom | Likely layer | What to verify next |
|---|---|---|
| Model never becomes ready | Loading or memory | Runtime logs, allocation errors, process exits, memory, and supported model format |
| Short prompts work but long prompts fail | Context capacity | Actual input tokens, full payload, context settings, memory growth, and tool schemas |
| First request is much slower | Cold initialization | Load duration and repeated trials after a defined cold reset |
| DNS time is high | Name resolution | Repeat the lookup, compare networks, and verify that connection and server timings remain normal |
| TCP or TLS setup is high | Network path or connection setup | Fresh versus reused connections, client network, packet loss, and another remote network |
| Request upload is slow | Client uplink or large payload | Payload bytes, upload rate, remote network, and whether the prompt contains unnecessary context |
| TTFB is high but native inference is normal | Queue, path, application, or response setup | Server receipt time, request queue, gateway logs, and response framing |
| First generated token takes a long time | Queue, cold load, or prompt evaluation | Warm state, input tokens, prompt-evaluation duration, and concurrent traffic |
| First token is fast but output crawls | Generation performance | Native generation rate, host utilization, model configuration, and contention |
| Second user waits behind the first | Queue or worker policy | Documented scheduling, batching, worker, and concurrency behavior |
| Both concurrent requests slow down | Resource contention | Aggregate memory, accelerator load, bandwidth pressure, and output lengths |
| Local stream is incremental, remote UI is not | Intermediary or client buffering | Public request with unbuffered curl, trace timestamps, and direct API output |
| Local request is refused | Local listener | Process state, bind address, target port, and host policy |
| Local works but public URL does not connect | Tunnel lifecycle or reachability | Connected Localtonet device, running tunnel, selected token, local IP, and port |
| Public URL returns an application error | Request or authentication | Status, response body, API route, headers, credentials, and JSON schema |
| Only one remote network is slow | Remote client path | Wireless quality, mobile variation, packet loss, client load, and another connection |
Use a disciplined order of operations
- Verify local HTTP correctness and expected status.
- Confirm that the model loads and remains stable.
- Record separate cold and warm trials.
- Capture DNS, connection, TLS, upload, TTFB, and total time.
- Use runtime-native prompt and generation metrics where available.
- Verify incremental streaming and timestamp chunk arrival.
- Introduce concurrency carefully.
- Create and start the Localtonet HTTP tunnel.
- Repeat the fixed request through the public URL.
- Correlate client and server timing before assigning a cause.
Once the bottleneck is identified, choose a remedy that acts on that layer. Reduce model, context, or concurrency demand for capacity problems. Use documented runtime settings for inference problems. Correct the client or intermediary when streaming is buffered. Repair the Localtonet target or lifecycle state for reachability problems. Investigate the remote network only when controlled results show that transport is the meaningful difference.
Frequently asked questions
Can a Localtonet HTTP tunnel make my local LLM generate faster?
No. The model continues to run on your hardware through your inference runtime. The tunnel provides a public route to the existing HTTP service. It does not add model memory or inference compute.
What is the difference between first byte and first token?
First byte is the first response byte received by the HTTP client. First token is the first actual model-generated token. Headers, metadata, event framing, or keepalive data can arrive before generated content, so TTFB may be lower than TTFT.
How should I calculate tokens per second?
Prefer the runtime's generated-token count divided by its native generation duration in seconds. If those values are unavailable, estimate from generated tokens and the interval between the first and final generated token. Do not call generated tokens divided by total HTTP time a pure generation rate.
Why is the first request slower than later requests?
The first request may include model loading, memory allocation, accelerator initialization, or another runtime startup task. Define a cold state, record cold trials separately, and compare them with repeated warm trials.
Does streaming increase generation speed?
Streaming normally changes when the client can see output, not how quickly the model performs inference. Measure native generation rate independently from first-token delay and total completion time.
Why does my local API work while the Localtonet URL does not?
Confirm that the selected Localtonet device is connected, the HTTP tunnel has been started, and the configured local IP and port match the verified API listener. If the client runs on another device, that device must be able to reach the target. Creating a tunnel does not start it.
Can I calculate tunnel overhead by subtracting localhost time from a remote request?
Not reliably. Those tests usually use different clients, origins, and network paths. Use a host-local baseline, a same-client LAN-versus-public comparison where possible, and server-side timing correlation. Disclose any controls you could not keep constant.
Does a public HTTPS URL authenticate users?
No. HTTPS protects transport, but it does not automatically add application authentication or authorization. If the model API lacks suitable controls, place a supported authenticated gateway in front of it and expose only the required routes.
Measure your local LLM before exposing it remotely
Establish a controlled local baseline, create a Localtonet HTTP tunnel to the verified API or authenticated gateway, and repeat the same request through the assigned public URL. Compare transport, runtime, streaming, and server-side timing before deciding where to optimize.
Get Started Free →